
Stop editing templates
Start building a plan that gets approved
Turn this template into a complete business plan with:
- Financial projections
- Loan-ready structure
- Clear repayment logic
Based on 40+ bank requirements

A coffee shop financial plan example is not primarily a forecast of how many cups a business can sell. Its real purpose is to test whether expected sales can support the cost structure, generate sufficient cash, and justify the capital required to open the business.
Turn this template into a complete business plan with:
Based on 40+ bank requirements




Most business plans fail not because of the idea — but because the numbers don’t prove repayment.
Build a bank-ready business plan in minutes
(with projections, structure, and validation)
That distinction matters because coffee can carry attractive product-level margins while the business itself operates on much thinner economics. Toast estimates that independent coffee shops average roughly a 2.5% coffee shop profit margin after labor, occupancy, utilities, ingredients, and other operating expenses. A coffee shop financial model therefore needs to connect customer traffic, average ticket, product mix, staffing, and fixed costs rather than treating revenue growth as proof of profitability.
The calculations below show how to build that model. Unless a figure is attributed to an external benchmark, dollar amounts and operating assumptions are illustrative examples and should be replaced with data for the specific location and concept.
At minimum, a coffee shop financial plan should contain:
The most important assumptions sit underneath those statements. A credible model identifies expected daily transactions, average ticket, operating days, sales mix, cost of goods sold (COGS), staffing requirements, wages, rent, utilities, merchant fees, marketing expenses, and initial working capital.
These inputs need to work together. Increasing projected transactions, for example, may require additional barista hours. Adding food can increase the average ticket but also changes COGS, spoilage, equipment requirements, and labor. Extending opening hours creates more sales capacity but only adds value if incremental revenue exceeds incremental labor and coffee shop operating costs.
For founders developing the broader operating and market assumptions behind these numbers, a Coffee Shop Business Plan example can provide the strategic framework around the financial model.
Startup costs vary substantially by location, size, condition of the premises, and concept. Toast notes that a small restaurant under 1,500 square feet may require as little as $25,000 when an existing space already contains furniture and equipment, while a new build with new equipment can approach $500,000. Coffee shop equipment alone can vary widely depending on the format and specification.
That makes a single “average startup cost” less useful than a category-by-category estimate.
| Startup cost | Illustrative range |
|---|---|
| Lease deposit and pre-opening rent | $8,000–$25,000 |
| Build-out and renovations | $30,000–$120,000 |
| Coffee, refrigeration and kitchen equipment | $25,000–$80,000 |
| Furniture, fixtures and POS | $10,000–$30,000 |
| Licenses, permits and professional fees | $3,000–$10,000 |
| Initial inventory and supplies | $5,000–$12,000 |
| Pre-opening payroll and training | $5,000–$15,000 |
| Launch marketing | $3,000–$10,000 |
| Working capital | $25,000–$60,000 |
| Illustrative total | $114,000–$362,000 |
These are planning examples, not industry benchmarks. Actual quotes, lease terms, wage rates, permit fees, and equipment specifications should replace them before the plan is presented to a lender or investor.
A contingency allowance also matters. Toast recommends setting aside approximately 10–15% of the project cafe startup budget for unexpected construction costs.
Working capital deserves particular attention. Buying an espresso machine is a startup investment; paying employees and rent while the shop is still building traffic is a liquidity requirement. A business can therefore stay within its construction budget and still run out of cash after opening.
The cleanest coffee shop revenue forecast starts with transactions rather than a top-down market-share estimate:
Suppose a coffee shop expects 220 transactions per day, an average ticket of $8.25, and 30 operating days:
220 × $8.25 × 30 = $54,450 monthly revenue
That calculation is simple. Defending the assumptions is harder. Transaction volume should reflect location traffic, opening hours, service capacity, comparable stores, seating or takeaway mix, and expected conversion. Average ticket should be built from the menu and expected product mix rather than selected because it produces the desired revenue.
In-store sales will typically form the core of the forecast. Separate customer volume by daypart if morning, lunch, and afternoon traffic behave differently.
For example, 150 morning transactions at a $7.50 average ticket and 70 later transactions at $9.85 produce approximately $1,815 in daily sales. That approach provides more analytical value than assuming one uniform customer profile throughout the day.
Food, delivery, packaged beans, merchandise, and catering can raise revenue per customer, but each channel has different economics.
A $5 pastry added to a coffee order increases the ticket but also carries ingredient or supplier costs and potential waste. Delivery can expand reach while adding platform commissions and packaging expenses. Retail beans may generate additional revenue without consuming seating capacity.
These streams should therefore be forecast separately instead of applying one gross-margin assumption to total sales.
A new coffee shop should rarely assume full expected traffic from its first month. The forecast should show a ramp as customers discover the location and repeat purchasing develops.
Seasonality should also be explicit. Toast notes that cafe and bakery transaction volumes vary by day of the week, with Saturday transactions averaging 15% above the weekly average in its research. Local weather, tourism, university calendars, holidays, and office attendance can create additional variation.
The financial model should reflect those effects rather than mechanically increasing revenue by the same percentage every month.
Revenue only becomes meaningful once it is connected to the costs required to generate it.
COGS includes coffee beans, milk, syrups, food, takeaway cups, packaging, and other products consumed with each sale. 7shifts places typical cafe COGS at roughly 25–35% of revenue and labor at approximately 25–35%, although actual ratios depend heavily on the operating model. Toast separately reports typical cafe food and beverage costs of roughly 15–25% at the individual menu-item level.
Rent and occupancy create another major constraint because they remain largely fixed when traffic falls. 7shifts suggests keeping rent plus utilities below approximately 10% of revenue as a general rule.
Merchant processing fees, delivery commissions, software subscriptions, insurance, maintenance, cleaning, accounting, and marketing then reduce the remaining margin. A financial plan should model each category separately because they respond differently when sales change.
Unit economics show whether an additional transaction actually creates enough value to support fixed operating costs.
Four metrics are particularly useful:
Consider an $8.25 average transaction with $2.25 of ingredients, packaging, merchant fees, and other transaction-linked costs. Contribution margin is $6.00, or approximately 72.7%.
That does not mean the coffee shop earns a 72.7% profit margin. The $6.00 contribution must still pay rent, salaried labor, utilities, insurance, software, marketing, maintenance, debt service, and other fixed or semi-fixed costs.
This is one of the most important distinctions in coffee shop financial planning: strong beverage margins do not automatically create a strongly profitable business.
Coffee shop break even analysis identifies the sales level at which contribution covers fixed operating expenses.
Assume monthly fixed costs of $28,000 and a contribution margin ratio of 68%.
$28,000 ÷ 0.68 = $41,176
The coffee shop therefore needs approximately $41,176 in monthly sales to reach operating break-even.
At an $8.25 average ticket:
$41,176 ÷ $8.25 = 4,991 transactions per month
Over 30 operating days:
4,991 ÷ 30 ≈ 166 transactions per day
That last figure is often more useful operationally than the dollar amount. Management can compare 166 daily transactions with actual foot traffic, service capacity, staffing, and local demand.
No connection between:
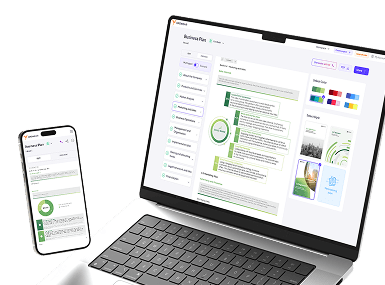
Growexa builds a complete, lender-ready business plan — with financial logic and a professionally formatted PDF
A credible coffee shop forecast requires all three financial statements because each answers a different question.
The P&L statement determines whether sales generate accounting profit after COGS and operating expenses. The coffee shop cash flow projection shows when money actually enters and leaves the business. The balance sheet tracks what the business owns, owes, and has accumulated in equity.
The statements must reconcile.
If the business buys a $30,000 espresso and refrigeration package for cash, the transaction reduces cash and increases fixed assets; it does not simply become a $30,000 operating expense on that month's P&L. If the purchase is debt-financed, cash, debt, interest expense, principal repayment, and the balance sheet all change differently.
A model that projects profit without connecting these movements can substantially misstate the capital the business needs.
Growexa's financial-planning workflow generates P&L, cash flow and balance sheet projections within the same business-plan structure, allowing the operating assumptions and funding requirements to be modeled together.
The following simplified Coffee Shop Financial Projections illustrates a first-year ramp. Figures are examples rather than industry benchmarks.
| Month | Revenue | COGS | Labor | Other OpEx | Operating Profit |
|---|---|---|---|---|---|
| 1 | $35,000 | $9,800 | $12,000 | $16,000 | -$2,800 |
| 2 | $38,000 | $10,640 | $12,200 | $16,000 | -$840 |
| 3 | $42,000 | $11,760 | $12,600 | $16,000 | $1,640 |
| 4 | $46,000 | $12,880 | $13,000 | $16,200 | $3,920 |
| 5 | $49,000 | $13,720 | $13,400 | $16,200 | $5,680 |
| 6 | $52,000 | $14,560 | $13,800 | $16,400 | $7,240 |
| 7 | $54,000 | $15,120 | $14,100 | $16,400 | $8,380 |
| 8 | $55,000 | $15,400 | $14,300 | $16,500 | $8,800 |
| 9 | $53,000 | $14,840 | $14,000 | $16,500 | $7,660 |
| 10 | $56,000 | $15,680 | $14,400 | $16,600 | $9,320 |
| 11 | $59,000 | $16,520 | $14,800 | $16,700 | $10,980 |
| 12 | $63,000 | $17,640 | $15,300 | $16,800 | $13,260 |
The table is useful only if every assumption behind it can be explained. Revenue growth should come from higher transaction volume, higher average ticket, or both. Labor increases should correspond to staffing needs. COGS should move with sales and product mix.
Funding changes the standard of evidence.
A lender will want to understand not simply whether the coffee shop becomes profitable, but whether cash generation provides sufficient capacity to service debt. That makes the amount borrowed, interest rate, repayment schedule, owner contribution, working-capital reserve, and downside scenario material assumptions.
Investors may focus more heavily on return on invested capital, payback period, unit economics, scalability, and whether the economics can be reproduced at a second location.
In either case, unsupported assumptions weaken the model. Rent should trace to a lease or market evidence. Equipment should trace to supplier quotes. Payroll should connect to staffing schedules and wage rates. Revenue assumptions should connect to capacity and market evidence.
The objective is not to produce the most optimistic forecast. It is to produce one whose logic survives scrutiny.
A strong coffee shop financial plan ultimately does something more useful than predict profit: it exposes what must be true for the business to work. Transactions, pricing, labor productivity, product mix and capital requirements become testable assumptions rather than optimistic estimates. Founders can build those assumptions into a complete financial model and funding-ready plan with Growexa Сoffee Shop Business Plan, then revise the projections as actual operating data replaces the original estimates.

