Ukraine
 USA
 Austria




A restaurant can be busy and still lose money. High guest traffic does not create profit when menu prices fail to cover food, labor, occupancy, delivery commissions, waste, and operating overhead. Revenue measures activity; contribution and cash flow determine whether the restaurant survives.
That is why a credible restaurant business plan must connect the concept to measurable operating capacity. It should show how many guests the location can serve, how often seats can turn, what each customer is expected to spend, how the menu produces margin, and what sales level is required to cover fixed costs.
The most dangerous assumption is that demand will correct weak economics. More orders can increase losses when low-margin items, overtime, discounting, packaging, or third-party delivery costs absorb the additional revenue. A strong plan therefore models sales, gross profit, operating profit, and cash flow separately.
What a Restaurant Business Plan Should Include
A business plan for opening a restaurant should define the concept, target customer, trade area, location, menu, pricing, service model, capacity, operations, staffing, marketing, startup budget, funding request, and financial projections.
The executive summary should present the concept, location, ownership, requested funding, opening schedule, and core financial case. The market section should establish local demand rather than relying on national restaurant sales. The operating plan should show how the kitchen, dining room, staffing schedule, suppliers, inventory controls, and technology support the projected guest volume.
The downloadable restaurant business plan template organizes these decisions into a lender-ready format. It includes the written strategy and the financial schedules needed to test startup costs, monthly sales, food and labor expenses, cash requirements, and repayment capacity.
Every section should use the same assumptions. If the marketing plan targets 200 daily covers, the location and operations sections must show enough seats, table turns, kitchen throughput, labor, and operating hours to serve them. If the menu promises premium positioning, the local market and guest experience must support the intended average check.
Define the Restaurant Concept
A restaurant concept is an operating model, not simply a cuisine. It combines food, service format, price point, atmosphere, location, dayparts, target customer, and reason to choose the restaurant over nearby alternatives.
A full-service restaurant relies on dining-room capacity, table turns, servers, kitchen coordination, and beverage sales. A limited-service concept may process more transactions with fewer front-of-house employees, but speed, order accuracy, packaging, and counter or digital throughput become central. Fast-casual, fine-dining, takeout-led, food-hall, and delivery-focused concepts require different investments and financial assumptions.
The plan should identify the primary customer and dining occasion. A restaurant designed for weekday office lunches faces different demand patterns from a destination dinner concept, neighborhood family restaurant, late-night operation, or weekend brunch venue. Trying to serve every occasion can increase menu size, inventory, staffing complexity, and marketing expense without creating a clear competitive position.
Price point must align with the target customer, service standard, portion size, ingredient quality, location, and competitive set. Premium pricing cannot be justified by food alone if the concept also requires reservations, trained service staff, tableware, interior design, and a more expensive location.
A small restaurant business plan should not copy the staffing, menu breadth, or revenue assumptions of a larger operation. Smaller dining rooms may reduce buildout and payroll requirements, but limited seating makes table utilization and average check more important.
Market and Competitor Analysis
Restaurant demand is local. National industry sales do not prove that another restaurant is needed within a specific trade area. The market analysis should identify the customers, occasions, and spending patterns the concept can realistically capture.
Define the trade area using travel time, neighborhood boundaries, employment centers, residential density, parking, transit, pedestrian movement, and delivery radius. The relevant radius may change by daypart: office workers can support lunch demand, nearby residents may drive dinner and weekend traffic, and destination concepts may attract guests from farther away.
Competitor analysis should compare concept, cuisine, price point, average review profile, hours, dayparts, seating, takeout and delivery availability, menu depth, perceived traffic, and positioning. Indirect competitors also matter. A lunch restaurant competes with grocery prepared foods, workplace cafeterias, convenience stores, and delivery-only brands—not only restaurants serving the same cuisine.
Market evidence should be translated into a sales case. Useful inputs include local customer interviews, foot-traffic observations, delivery-platform activity, competitor visits, reservation availability, nearby employer counts, residential development, tourism, venue demand, and prior operating results where available.
The analysis should also identify the market gap without overstating it. Limited direct competition may indicate an opportunity, but it may also signal inadequate demand, unsuitable real estate, restrictive zoning, or weak economics.
Location and Capacity
A restaurant location affects demand, occupancy cost, staffing access, delivery logistics, licensing, construction expense, and maximum revenue. A strong address can still be financially unattractive if rent, buildout, or physical limitations absorb the restaurant’s operating margin.
The plan should document visibility, access, parking, pedestrian traffic, vehicle counts where relevant, neighboring businesses, delivery access, signage, utilities, ventilation, grease management, waste handling, zoning, and permitted occupancy. Existing restaurant infrastructure can reduce construction requirements, but all equipment and systems should be inspected before their value is assumed.
Capacity should be modeled by daypart rather than by seat count alone. A 60-seat restaurant does not automatically sell 60 meals. Sales depend on occupancy, table turns, party size, operating hours, reservation patterns, and the time guests occupy each table.
A practical dine-in capacity formula is: Daily covers = Available seats × Seat utilization × Table turns
For example, 60 seats at 75% utilization and 1.8 turns produce approximately 81 covers during a service period. Lunch and dinner should be calculated separately because duration, demand, staffing, and average check may differ.
Takeout, delivery, catering, and bar sales can expand revenue beyond dining-room capacity, but they still use kitchen stations, storage, packaging space, labor, and pickup access. The plan should identify the first constraint likely to limit sales: seats, kitchen throughput, cooks, servers, parking, delivery handoff, or management attention.
Menu and Revenue Model
The menu determines revenue, purchasing, preparation, equipment, staffing, inventory, waste, and brand positioning. It should be designed as both a customer-facing product and an operating system.
Restaurant sales may include dine-in food, beverages, takeout, direct delivery, third-party delivery, catering, private events, merchandise, or other concept-specific streams. Each channel should be modeled separately when its average check, direct costs, commissions, packaging, or labor requirements differ.
The core sales formula is: Restaurant sales = Covers × Average check
A more detailed forecast separates dayparts and channels: Monthly sales = Sum of daily covers by daypart × average check × operating days, plus off-premise and other revenue
Average check should be calculated from realistic menu mix, not selected as a round target. It depends on entrée prices, appetizers, beverages, desserts, discounts, taxes, and the average number of items per transaction.
Menu engineering should evaluate popularity and contribution margin. A high-selling item may generate weak contribution if ingredients, preparation time, waste, or discounting consume most of its price. Conversely, a higher-margin item produces little financial value if guests rarely order it.
The plan should limit unnecessary menu complexity. Excessive item counts increase ingredients, storage, prep procedures, training, ticket times, and spoilage. The objective is a menu that customers value and the kitchen can execute consistently at projected volume.
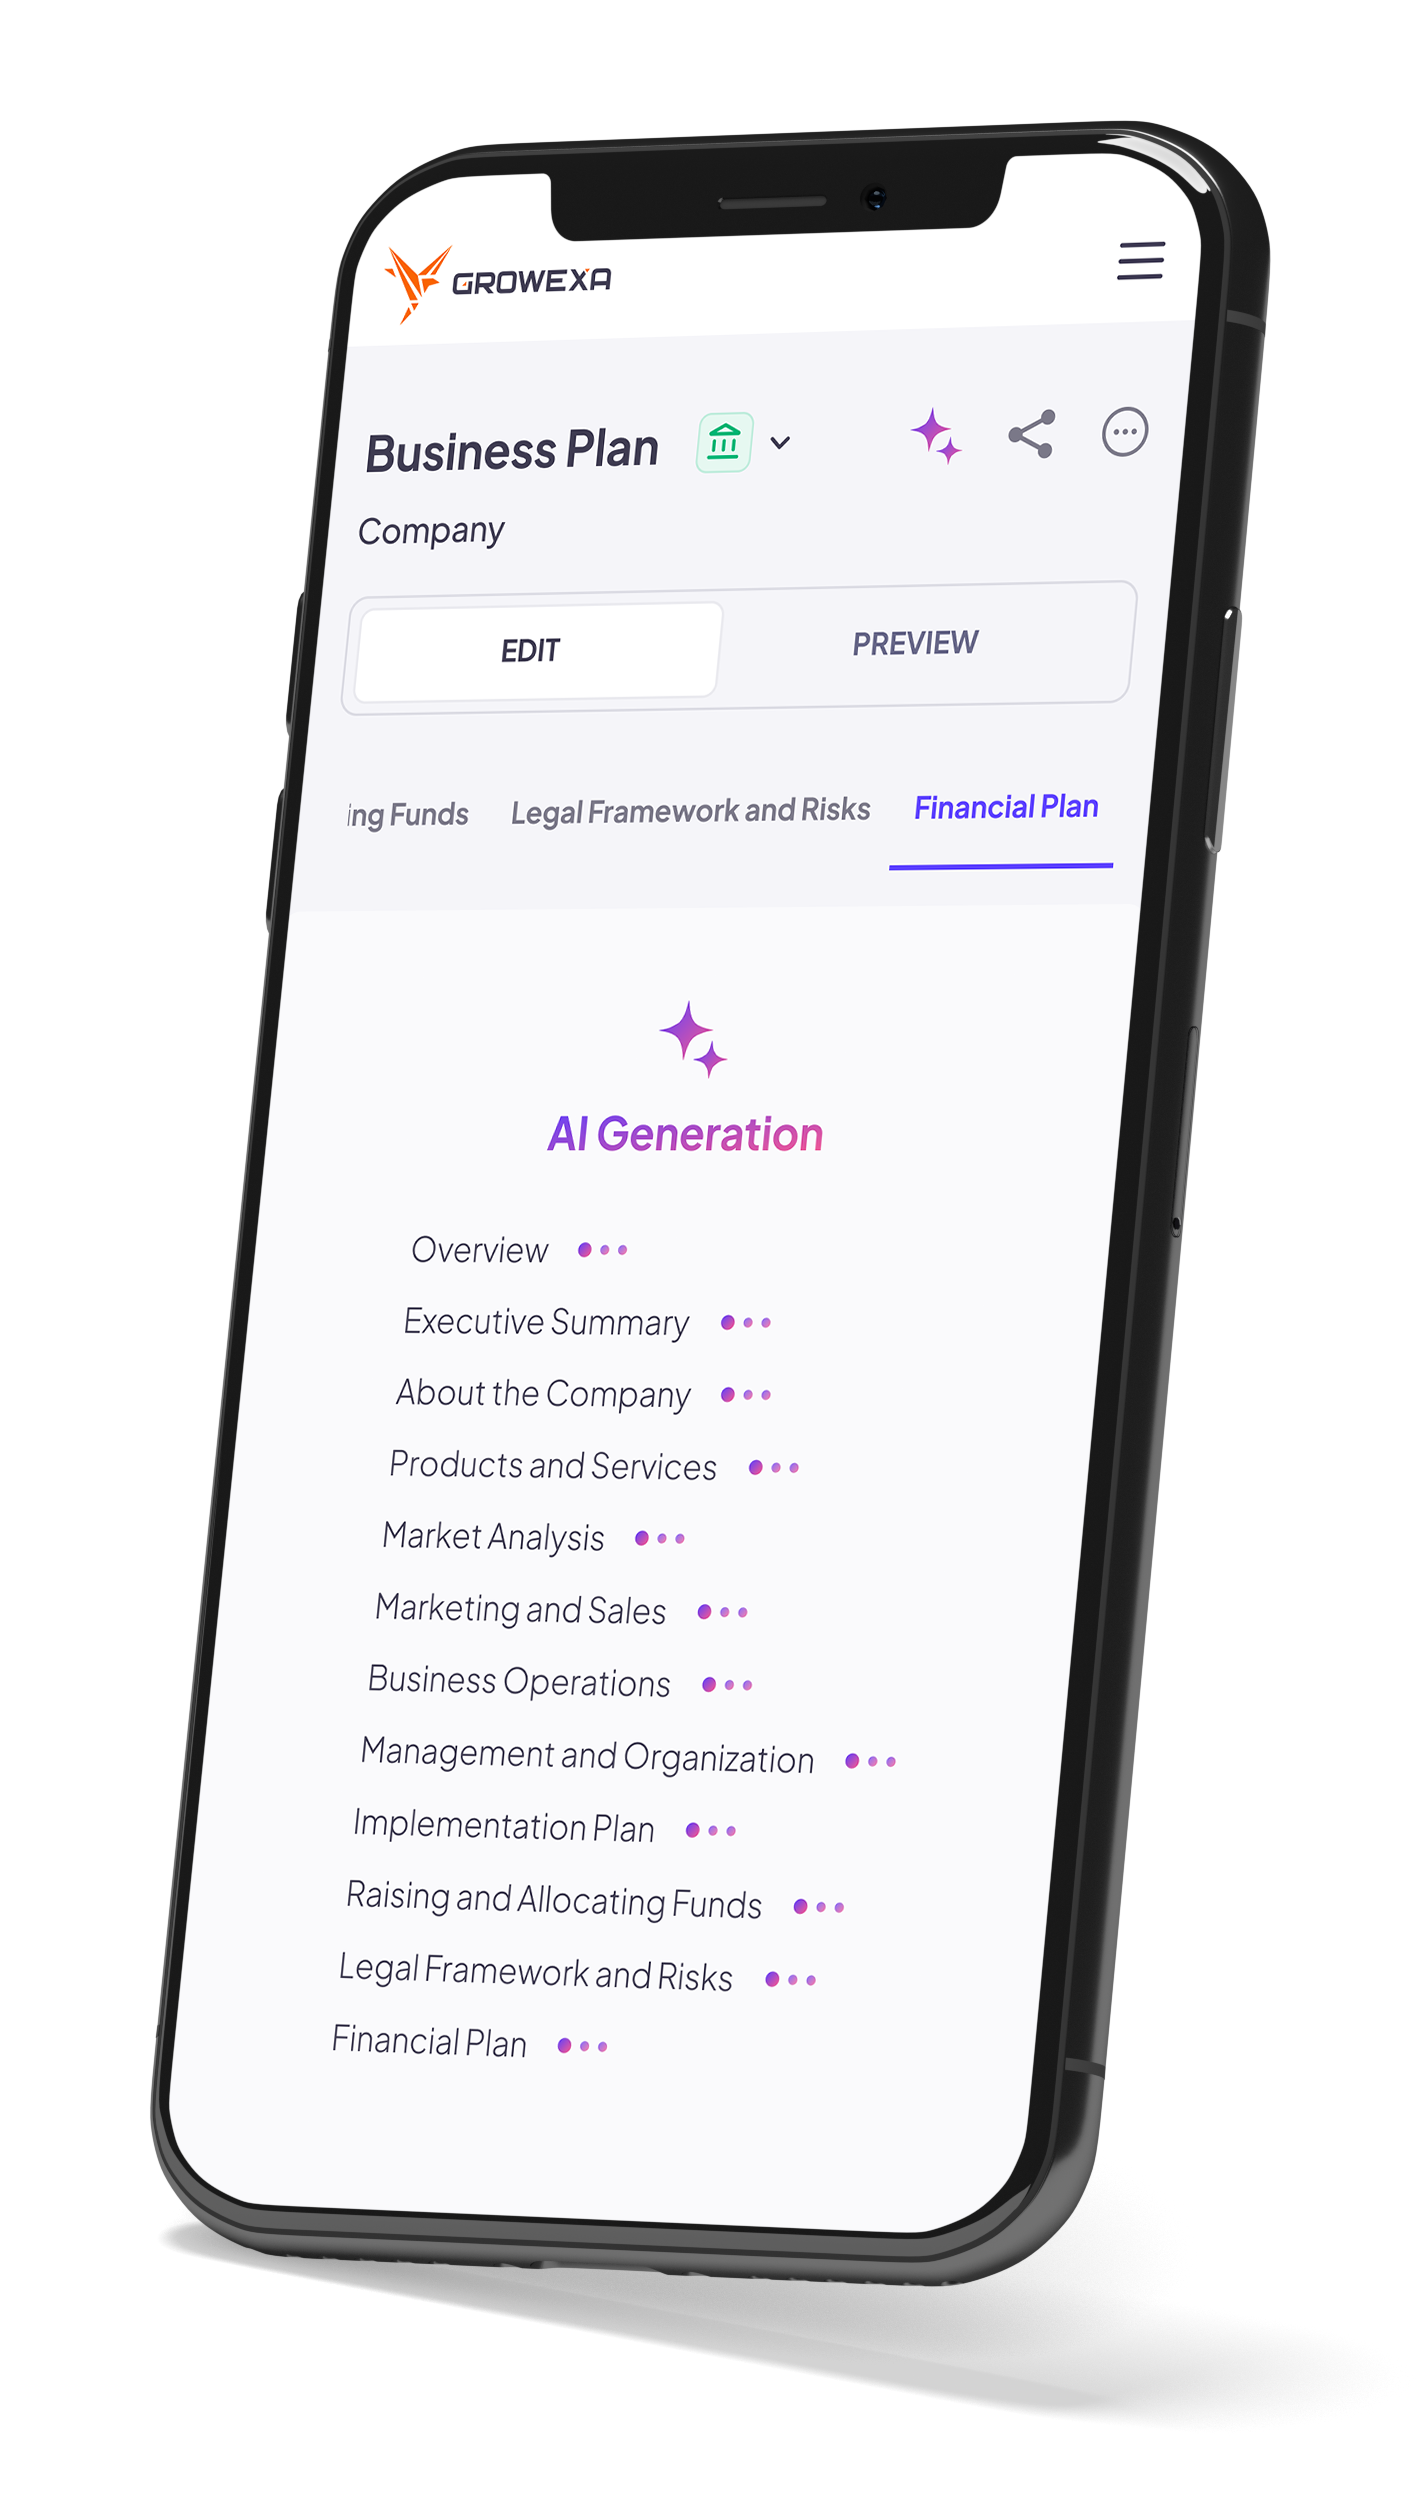
Monthly Restaurant Sales Calculator
Restaurant Startup Costs
Restaurant startup costs depend on the concept, location, building condition, kitchen requirements, seating capacity, liquor licensing, and whether the site was previously used as a restaurant.
The following ranges are illustrative planning allowances, not industry averages. Every amount should be replaced with site-specific quotes.
| Startup category | Illustrative planning range |
|---|---|
| Lease deposit and advance rent | $10,000–$50,000 |
| Design, permits, and professional fees | $15,000–$75,000 |
| Construction and leasehold improvements | $100,000–$750,000+ |
| Kitchen and refrigeration equipment | $75,000–$300,000 |
| Furniture, fixtures, and décor | $30,000–$150,000 |
| POS, ordering, security, and IT systems | $8,000–$35,000 |
| Licenses, inspections, and training | $5,000–$30,000+ |
| Opening food, beverage, and packaging inventory | $10,000–$40,000 |
| Smallwares, tableware, and uniforms | $15,000–$60,000 |
| Pre-opening recruitment and payroll | $25,000–$100,000 |
| Website, signage, and launch marketing | $10,000–$50,000 |
| Insurance deposits and professional services | $8,000–$30,000 |
| Working-capital reserve | $75,000–$300,000+ |
| Illustrative total | $386,000–$1,970,000+ |
The range can be lower for a compact concept taking over a well-equipped restaurant space and substantially higher for ground-up construction, major structural work, or premium interiors. Liquor-license costs vary sharply by jurisdiction and should not be represented by a national allowance.
The startup budget should separate building improvements from removable equipment, opening expenses, and working capital. This distinction helps owners and lenders assess collateral, depreciation, landlord contributions, and the cash required before the restaurant reaches break-even sales.
Working capital supports payroll, food purchases, rent, utilities, marketing, and debt payments while the restaurant is building repeat traffic and correcting early operating problems.
Food, Labor and Prime Cost
Food and labor jointly determine whether restaurant sales convert into gross profit. Their combined amount is commonly treated as prime cost because management decisions affect both categories daily.
Food and beverage cost should be calculated from actual recipe quantities, purchase prices, yields, waste, spoilage, staff meals, discounts, and inventory movement. Applying one percentage to the entire menu can obscure major differences among entrées, beverages, sides, and delivery items.
The theoretical food cost for an item is: Ingredient cost per serving ÷ Menu price
If ingredients cost $8 and the item sells for $25, the theoretical food-cost percentage is 32%. That calculation does not include production labor, card fees, occupancy costs, or overhead, and it assumes the portion and purchase price remain consistent. Labor includes more than hourly wages. The model should account for management salaries, payroll taxes, benefits, overtime, training, workers’ compensation, paid leave where applicable, and opening and closing work performed outside service hours. Prime cost can rise even when food-cost and wage rates appear stable. Weak scheduling, overtime, overproduction, poor portion control, theft, complimentary items, discounts, and slow service can reduce output per labor hour and increase cost per cover. The National Restaurant Association reports that food and labor each account for approximately one-third of sales across the restaurant sector, while actual cost structures vary by concept and sales volume. These figures are reference points, not guaranteed targets for an individual restaurant.
Operations and Staffing
Restaurant operations convert ingredients, labor, equipment, and space into consistent guest experiences. The plan should document purchasing, receiving, storage, preparation, service, cleaning, cash controls, inventory counts, waste tracking, maintenance, and closing procedures.
The kitchen plan should identify stations, production flow, prep schedules, equipment capacity, ticket-time expectations, and responsibility for food safety. Procurement should address primary and backup suppliers, order frequency, price changes, minimum quantities, and receiving controls.
Front-of-house planning should cover reservations, seating, order entry, payment, guest recovery, takeout pickup, and coordination with the kitchen. A service model that appears simple to the guest may still require detailed timing and communication behind the scenes.
The staffing model should begin with positions and scheduled hours. Management, cooks, prep staff, dishwashers, servers, bartenders, hosts, counter staff, and delivery personnel should be added only where the concept requires them. Payroll projections should then include wage rates, taxes, benefits, overtime, training, and turnover. Schedules should respond to hourly demand instead of applying one labor percentage to every month. Lunch, dinner, weekends, events, and seasonal peaks may require different coverage. Understaffing can reduce payroll on paper while lowering table turns, order accuracy, guest retention, and sales.
Inventory controls should compare theoretical usage with actual consumption. Regular counts, standardized recipes, portion tools, receiving checks, waste logs, and POS reporting help identify price variance, spoilage, overportioning, and unexplained loss.
Restaurant Financial Projections
Restaurant financial projections should begin with operational drivers: seats, covers, table turns, average check, operating days, channel mix, food cost, labor hours, occupancy expense, and other fixed costs.
The first year should be modeled monthly. New restaurants rarely open at stabilized volume, and sales may vary by weekday, season, weather, tourism, nearby office activity, and local events. A straight-line annual forecast can conceal the cash needed during the sales ramp.
The following example uses hypothetical monthly assumptions and is not an industry benchmark.
| Financial driver | Illustrative assumption |
|---|---|
| Seats | 60 |
| Average covers per day | 150 |
| Average check | $32 |
| Operating days per month | 26 |
| Monthly sales | $124,800 |
| Food and beverage cost | $37,440 |
| Labor cost and payroll burden | $41,184 |
| Prime cost | $78,624 |
| Occupancy cost | $10,500 |
| Utilities, repairs, and cleaning | $6,000 |
| Merchant, delivery, and technology fees | $5,200 |
| Marketing, insurance, and administration | $7,000 |
| Other operating expenses | $5,000 |
| Illustrative operating profit | $12,476 |
In this example, food and beverage cost equals 30% of sales, labor equals 33%, and prime cost equals 63%. The remaining $46,176 is not net profit: it must cover rent, utilities, maintenance, fees, insurance, marketing, administration, debt service, taxes, and owner compensation where applicable.
The forecast should include projected income statements, cash flow, balance sheets, capital expenditures, inventory, debt payments, and sensitivity cases. Sales, gross profit, operating profit, and cash flow should never be used interchangeably.
A downside case should test fewer covers, a lower average check, higher food prices, wage increases, slower table turns, delivery commissions, equipment repairs, and delayed opening. A restaurant with positive annual operating profit can still experience a cash deficit in individual months.
Break-Even Analysis
Break-even analysis estimates the sales required to cover fixed and variable costs before the restaurant generates operating profit.
The standard formula is: Break-even sales = Fixed operating costs ÷ Contribution margin ratio
Contribution margin equals sales minus costs that change with sales. In a simplified restaurant model, variable expenses may include food and beverages, hourly labor that changes with volume, packaging, merchant fees, and delivery commissions. Management should not classify expenses as variable merely to improve the result.
Suppose fixed monthly costs equal $42,000 and variable costs equal 65% of sales. The contribution margin ratio is 35%.
$42,000 ÷ 35% = $120,000 in monthly break-even sales
At an average check of $32 and 26 operating days, the restaurant would require approximately: $120,000 ÷ $32 ÷ 26 = 145 covers per day
This result must be compared with practical capacity. If the restaurant can serve only 120 covers per day under its current seating, table-turn, kitchen, and staffing assumptions, the business cannot reach break-even without changing price, menu mix, operating hours, cost structure, or capacity.
Break-even should also be calculated after debt service and required owner compensation where relevant. The accounting break-even point may not represent the cash level needed to meet every financial obligation.
Funding a Restaurant
Restaurant financing should be tied to a detailed sources-and-uses schedule. A lender is not financing a broad ambition to open a restaurant; it is financing defined expenditures and evaluating whether future cash flow can repay the obligation.
The funding request should separate leasehold improvements, kitchen equipment, furniture, technology, opening inventory, professional fees, pre-opening payroll, marketing, and working capital. Each material purchase should be supported by current estimates or vendor quotations.
Owner contribution may be required depending on the lender, borrower, project, and financing structure. The plan should explain how much capital the owners will invest, when it will be available, and whether additional funds remain outside the project for contingencies.
Working capital should support the restaurant through opening delays, initial inefficiency, uneven traffic, and the period before repeat demand develops. Using nearly all available funding for construction may leave a completed restaurant without enough cash to operate.
What Lenders Check First
| Lenders verify | Numbers reviewed first | Common reason for concern |
|---|---|---|
| Evidence of local demand | Traffic, reservations, pipeline, and competitor indicators | Forecast relies only on national growth |
| Realistic sales capacity | Seats, covers, table turns, and operating hours | Projected sales exceed physical capacity |
| Menu economics | Average check and contribution by category | Prices ignore food, labor, and channel costs |
| Complete startup budget | Contractor bids, equipment quotes, and contingency | Buildout or pre-opening costs are understated |
| Adequate working capital | Monthly cash deficit during ramp-up | All funding is allocated to construction |
| Management capability | Relevant operating and financial experience | No plan for restaurant-level controls |
| Repayment capacity | Cash flow after debt service | Profit is shown without debt or taxes |
| Downside resilience | Lower-sales and higher-cost scenarios | Forecast has no room for delays or volatility |
An SBA-backed or conventional bank loan may finance eligible restaurant costs, but neither structure guarantees approval. Lenders will assess the owners, collateral where applicable, equity contribution, management experience, projections, cash flow, and ability to absorb a downside case.
The plan should allow a reviewer to trace borrowed funds from startup expenditure through operating capacity, sales, contribution, cash flow, and repayment.
Restaurant Business Plan Template and Example
A restaurant business plan sample or restaurant business plan example can demonstrate how the sections fit together, but its numbers should not be copied. Rent, wages, menu pricing, food cost, seating, table turns, construction requirements, and local demand differ by restaurant.
The downloadable restaurant business plan PDF provides a presentation-ready structure covering the executive summary, company description, concept, market, location, menu, operations, staffing, marketing, startup costs, funding, and financial projections.
The Word version can be adapted to the owner’s concept and supporting evidence. Replace sample assumptions with the proposed address, lease terms, floor plan, seat count, operating hours, menu prices, recipe costs, supplier quotes, staffing schedule, construction estimates, and financing terms.
The restaurant business plan format should remain internally consistent. If the seat count, menu, service style, location, or opening schedule changes, the operating plan, startup budget, sales forecast, staffing requirements, and cash-flow model should also change.
Build a Restaurant Plan Around Unit Economics
A restaurant is not financially sound merely because guests like the concept or the dining room appears busy. It becomes sustainable when every sales channel produces enough contribution to support prime cost, occupancy, overhead, working capital, and debt service.
Growexa connects covers, average check, menu costs, staffing, capacity, startup investment, and funding requirements in one lender-ready financial model.