Ukraine
 USA
 Austria




An ecommerce company can grow revenue while making its financial position worse.
That sounds contradictory until inventory, customer acquisition, and cash timing enter the model. A store can double sales by spending aggressively on paid media, buying more inventory, and discounting to increase conversion. Revenue rises. At the same time, customer acquisition cost can outrun contribution margin, returns can consume gross profit, and cash can become trapped in inventory months before the products are sold.
That is why a credible ecommerce business plan cannot be a generic retail plan with “online” added to the sales strategy. Ecommerce has its own operating math: traffic, conversion rate, average order value (AOV), customer acquisition cost (CAC), gross margin, returns, fulfillment cost, repeat purchase behavior, and inventory turnover.
The market opportunity remains substantial. U.S. retail ecommerce sales reached an estimated $340.2 billion in the second quarter of 2026, up 12.2% from a year earlier and representing 17.1% of total retail sales on a seasonally adjusted basis. But market growth does not solve store-level economics. A business plan needs to show how this particular ecommerce company converts demand into profitable orders—and how much capital is required before those orders generate sustainable cash flow.
Free Ecommerce Business Plan Template + PDF
A useful ecommerce business plan template should connect the commercial story to the operating model. It needs to explain what the company sells and to whom, but also how customers are acquired, what each order contributes, how inventory is financed, and what happens to cash as the business scales.
That makes it different from a generic online store business plan. A simple online-store plan may be sufficient for a small retailer whose website is primarily another sales channel. A DTC brand, subscription company, Amazon seller, or ecommerce startup built around paid acquisition needs substantially more detail around channel economics.
A lender or investor should be able to move from the marketing plan to the financial model without finding a break in the logic. If the plan assumes 100,000 monthly visitors, a 2.5% conversion rate, and a $75 AOV, those assumptions should produce the revenue forecast. If customer acquisition costs $30 per new buyer, that cost should appear in the economics. If inventory must be ordered 90 days before it is sold, the cash-flow forecast needs to reflect that timing.
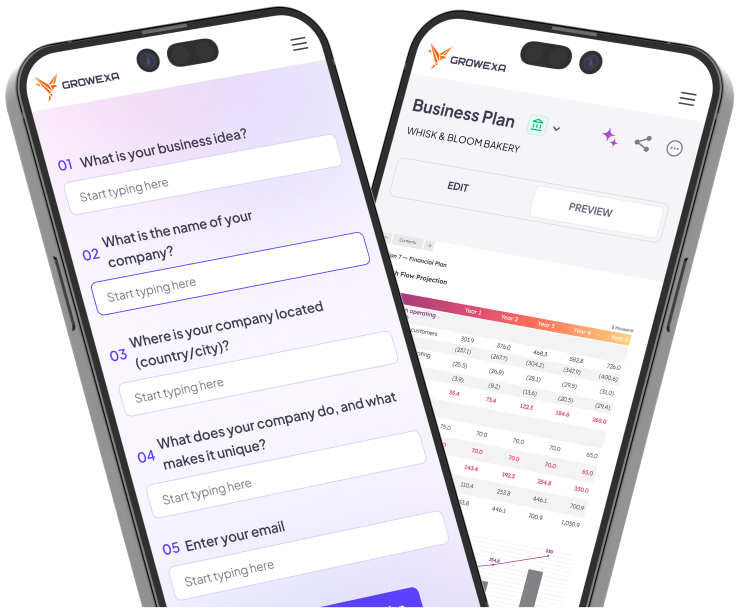
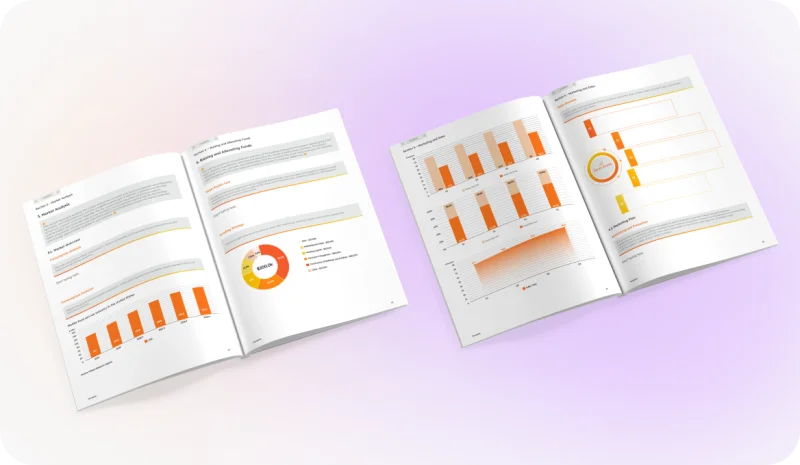
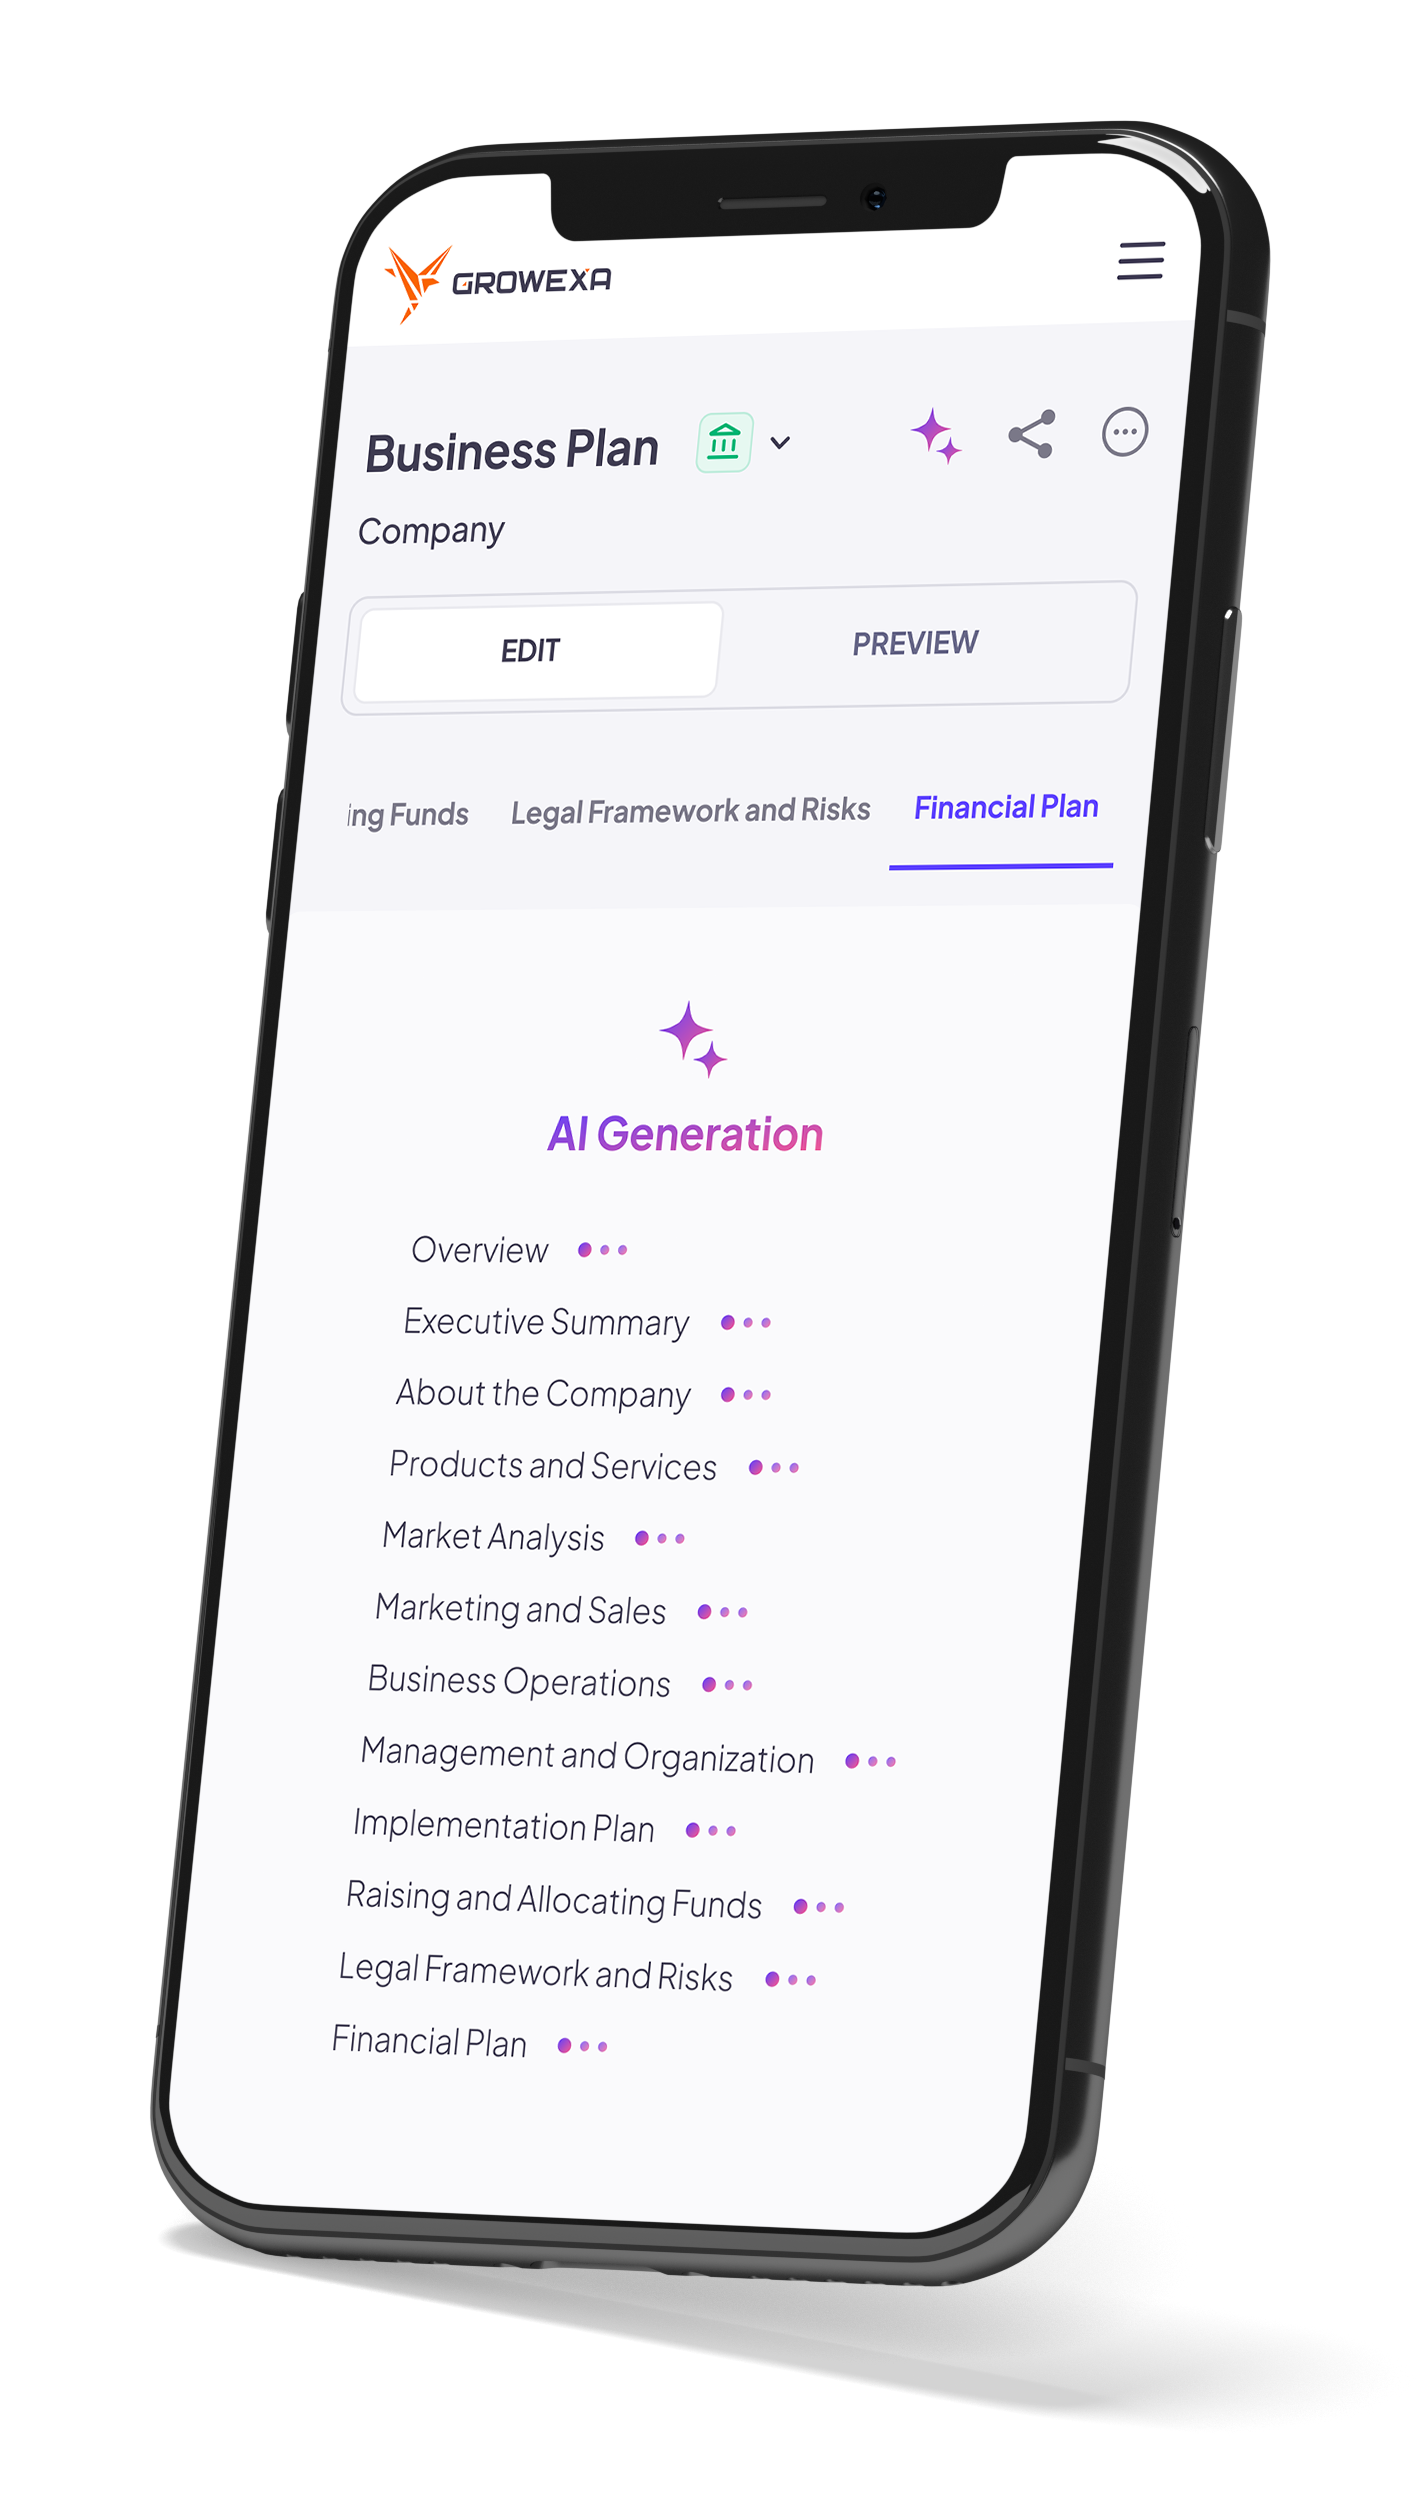
Growexa's AI Business Plan Generator can be used to build the narrative and financial model together and prepare the completed plan for PDF export. An ecommerce business plan PDF is useful for lenders and investors, but the document itself is only the output. The underlying assumptions are what make it credible.
Ecommerce Business Key Facts
There is no universal benchmark that can safely be inserted into every ecommerce forecast. Conversion rates, margins, returns, CAC, and inventory cycles differ substantially by category, price point, channel, and business model. Shopify, for example, cites 2026 conversion benchmarks ranging from 0.63% for luxury and jewelry to 5.7% for pet care and veterinary services.
The figures below are therefore illustrative planning assumptions, not ecommerce industry averages.
| Metric | Illustrative Planning Assumption | Why It Matters |
|---|---|---|
| Startup capital | $25,000–$100,000+ | Depends heavily on inventory and acquisition strategy |
| Product gross margin | 55% | Determines how much remains to fund selling and overhead |
| CAC | $25 | Must be supported by contribution and customer value |
| Conversion rate | 2.5% | Converts qualified traffic into orders |
| AOV | $80 | Major driver of revenue and contribution per transaction |
| Return rate | 10% | Reduces realized revenue and creates reverse-logistics cost |
| Fulfillment cost | $7/order | Directly reduces order contribution |
| Inventory cycle | 60–120 days | Determines working-capital requirements |
| Break-even driver | Contribution/order × orders | More useful than revenue alone |
Returns deserve particular scrutiny. The National Retail Federation estimated that 19.3% of online sales would be returned in 2025 across the retail businesses covered by its research. That is not a forecast every ecommerce company should use; category-specific rates can differ sharply. It does demonstrate why a plan that models sales but ignores returns is incomplete.
Choose Your Ecommerce Model
The ecommerce model determines where capital is committed, how margin is created, and which risks dominate the financial plan. A founder should choose the model before building projections rather than applying one set of assumptions to every type of online business.
DTC Brand
A direct-to-consumer brand controls its website, merchandising, customer relationship, and pricing. It can potentially retain more gross profit per sale than a wholesale model, but it also carries the cost of generating its own demand.
The central DTC question is therefore not simply whether gross margin is attractive. It is whether gross margin remains sufficient after CAC, fulfillment, payment processing, returns, discounts, and customer service.
DTC brands with physical products also carry inventory risk. Growth can consume cash because larger sales forecasts often require larger purchase orders before the corresponding customer revenue arrives.
Marketplace/Amazon
Marketplace businesses gain access to established consumer traffic but operate inside another company's commercial system. Fees, fulfillment requirements, advertising, storage, returns, ranking, and platform rules all affect economics.
An Amazon FBA business plan, for example, should model marketplace-specific fees and inventory requirements rather than using DTC fulfillment assumptions.
Channel concentration also belongs in the risk section. A business generating most of its revenue through one marketplace has less control over customer access than a company with a diversified channel mix.
Dropshipping
A dropshipping business plan has a different capital profile because the retailer does not normally purchase large quantities of inventory before customer orders arrive.
That reduces inventory exposure but does not eliminate operating risk. The business gives up control over parts of fulfillment, product availability, packaging, and delivery performance. Product margins may also be thinner.
Dropshipping therefore shifts the problem. Instead of asking, “How much cash will inventory consume?” the plan needs to ask whether the remaining contribution after supplier cost and customer acquisition can support the business.
Subscription
Subscription models change the economics because a customer may produce multiple orders after the initial acquisition.
A subscription box business plan should therefore separate first-order economics from customer-level economics. CAC can exceed the contribution from the first shipment and still make commercial sense if retention is strong enough.
That makes churn a financial variable. A forecast assuming customers remain for eight months will look very different from one in which they cancel after three. The model should derive lifetime value from observed or defensible retention assumptions rather than using an aspirational LTV:CAC ratio.
Hybrid Retail + Ecommerce
A hybrid model combines ecommerce with physical retail, pop-ups, wholesale, or other offline channels.
This can diversify acquisition and distribution, but it complicates financial analysis. Store sales, online orders, and wholesale shipments have different margins and cost structures. Inventory may also move between channels.
The business plan should therefore model channel economics separately before consolidating them into company-level projections.
Ecommerce Market and Customer Analysis
A large ecommerce market is not the same thing as an addressable market.
The Census Bureau's $340.2 billion quarterly ecommerce figure establishes the scale of U.S. online retail. It says little about how many customers are realistically available to a specific premium skincare brand, specialty pet retailer, or B2B equipment store.
Market analysis should move from category demand to the customer segment the company can actually reach. Define the buyer, purchase occasion, alternatives, price sensitivity, purchase frequency, and channels through which the customer discovers products.
Then quantify the opportunity.
A structured TAM, SAM and SOM analysis is particularly useful when an ecommerce startup business plan is being prepared for outside funding. TAM may represent total category spending. SAM narrows that opportunity by geography, customer type, product positioning, or channel. SOM should reflect what the company could realistically capture given acquisition budget, conversion, inventory, and operating capacity.
Competitor analysis should also go beyond comparing product prices. An ecommerce competitor with a higher retail price may still have stronger economics because it generates more organic traffic, has higher repeat purchasing, or earns a larger AOV through bundles.
The relevant question is not merely, “Who sells a similar product?” It is, “What commercial system allows them to acquire and retain this customer?”
Product Economics and Pricing
Ecommerce pricing should be built around contribution, not markup alone.
Consider a product with an $80 selling price and a $28 landed cost. Its product-level gross profit is $52, producing a 65% gross margin.
That is only the beginning.
| Illustrative Order Economics | Amount |
|---|---|
| AOV | $80.00 |
| Landed product cost | ($28.00) |
| Gross profit | $52.00 |
| Fulfillment/shipping subsidy | ($7.00) |
| Payment processing | ($2.60) |
| Returns/discount allowance | ($4.40) |
| Contribution before CAC | $38.00 |
| CAC | ($25.00) |
| Contribution after CAC | $13.00 |
The product has a 65% gross margin but only $13 of modeled contribution after acquisition.
That distinction changes strategic decisions. If CAC rises from $25 to $35, contribution falls to $3. Increasing revenue through paid acquisition could then add very little economic value.
A higher AOV can change the equation. Bundles, multipacks, cross-sells, and thresholds for free shipping can spread acquisition and fulfillment costs across more revenue. But increasing AOV through aggressive discounts can produce the opposite result.
The ecommerce business plan example should therefore show the bridge from selling price to contribution rather than stopping at gross margin.
Revenue Calculator
Customer Acquisition and Marketing
An ecommerce marketing plan should explain where customers come from and what it costs to acquire them.
Paid search, paid social, creators, affiliates, organic search, email, SMS, referral programs, marketplaces, and partnerships can all play a role. They should not be treated as interchangeable sources of traffic.
The financial model needs a causal chain:
Traffic × Conversion Rate = Orders
Orders × AOV = Gross Revenue
For example, 100,000 monthly visits at a 2.5% conversion rate generate 2,500 orders. At an $80 AOV, that produces $200,000 in gross order value before cancellations and returns.
Conversion assumptions require context. Shopify notes that conversion rates vary materially by product category, price, traffic source, device, and other factors; the broad benchmarks are better treated as reference points than as performance targets.
CAC needs the same discipline. If a business spends $60,000 on acquisition and generates 2,000 new customers attributable to that spending, the simple CAC is $30.
But a company with repeat purchasing can tolerate a different first-order CAC from a company whose customers buy once. That is why acquisition strategy should connect to retention, repeat purchase rate, and customer lifetime contribution.
The business should know not only whether an ad campaign generates revenue, but whether the customers acquired through it generate enough contribution to justify the capital spent acquiring them.
Fulfillment, Inventory and Returns
Inventory is where profitable ecommerce growth can become a cash problem.
Suppose a company expects $300,000 in sales next quarter and needs $100,000 of inventory to support them. If suppliers require a 30% deposit three months before delivery and the balance before shipment, much of the cash leaves the business before customers place their orders.
Growth increases the next purchase order again.
This is why an income statement alone can misrepresent the capital requirements of an inventory-based ecommerce company. Gross profit may be positive while cash falls because the company is financing future sales.
The plan should show supplier lead times, MOQs, payment terms, safety stock, inventory turnover, fulfillment arrangements, and reorder triggers. Slow-moving stock deserves particular attention because it ties up cash and may eventually require discounting.
Returns complete the cycle. NRF's 2025 research estimated online returns at 19.3% of online sales and found that 82% of consumers considered free returns important when shopping online. A returns policy can therefore affect both conversion and cost.
The correct assumption is category-specific. A consumable subscription, apparel company, furniture retailer, and electronics store should not share one return-rate forecast.
Ecommerce Financial Projections
Strong ecommerce financial projections are built from operational drivers rather than a top-down statement that revenue will grow 50% next year.
Start with traffic and channel mix. Apply conversion assumptions to estimate orders, then AOV to estimate sales. Adjust for cancellations, discounts, and returns. From realized revenue, deduct product costs to calculate gross profit.
Then model the costs of producing those orders: payment processing, fulfillment, shipping subsidies, marketplace fees where applicable, customer service, and acquisition.
Consider this simplified three-year DTC model:
| Financial Driver | Year 1 | Year 2 | Year 3 |
|---|---|---|---|
| Orders | 15,000 | 25,000 | 38,000 |
| AOV | $80 | $84 | $88 |
| Gross order value | $1.20M | $2.10M | $3.34M |
| Realized revenue after modeled returns/discounts | $1.08M | $1.91M | $3.07M |
| Gross margin | 62% | 63% | 64% |
| Average CAC | $28 | $26 | $25 |
| New customers | 10,000 | 15,000 | 21,000 |
| Acquisition spend | $280K | $390K | $525K |
These figures are purely illustrative. The important part is how they connect.
If Year 2 revenue depends partly on repeat customers, the forecast should not charge acquisition cost as if every order came from a new customer. If margin improves, the model should explain whether that comes from supplier pricing, higher AOV, lower discounts, product mix, or another operational change.
Cash flow requires a second layer. Inventory purchases need to follow the purchasing calendar, not simply cost of goods sold. A business may recognize the cost of a product when it is sold while paying its supplier months earlier.
That difference creates the cash conversion cycle that can make fast growth capital-intensive.
A complete set of financial projections should connect the income statement, cash flow statement, and balance sheet. SBA guidance similarly recommends that businesses seeking financing support their funding request with forecast income statements, balance sheets, cash-flow statements, and capital expenditure budgets, with more detailed monthly or quarterly projections in the first year.
For ecommerce, the most useful downside scenario is often not simply “sales decline 20%.” Test what happens if CAC rises, conversion falls, returns increase, or inventory takes longer to sell. Those variables reveal where the business model is actually fragile.
Ecommerce Business Plan for Investors or Lenders
An ecommerce business plan for investors and one prepared for a lender can use the same operating model, but the emphasis changes.
| Area | Investor Emphasis | Lender Emphasis |
|---|---|---|
| Market | Addressable opportunity and category growth | Evidence of sustainable demand |
| Growth | Acquisition scalability and expansion | Forecast credibility |
| Unit economics | CAC, LTV, contribution, retention | Margin and cash generation |
| Capital | Growth milestones created by funding | Specific use of borrowed funds |
| Financial outcome | Enterprise-value potential | Repayment capacity |
| Risk | Ability to scale despite uncertainty | Ability to service debt under downside conditions |
Equity investors can accept current losses when they believe capital is creating a much larger and more valuable company. Lenders generally need evidence that the business can generate enough cash to meet contractual debt payments.
SBA guidance reflects that distinction: investors focus on the potential return on investment, while lenders evaluating startup funding commonly expect a business plan, defined use of funds, and projections showing how the financing can be repaid.
Founders raising equity can use an investor business plan to make the growth thesis explicit. Debt-funded businesses need the same operational rigor but should place more weight on cash flow, working capital, and downside repayment capacity.
Ecommerce Business Plan Structure
Learning how to write an ecommerce business plan starts with the standard logic of a business plan but adapts every section to online commerce. SBA notes that traditional plans commonly cover an executive summary, company description, market analysis, organization and management, products or services, marketing and sales, funding request, financial projections, and supporting materials.
For an ecommerce company, those sections should answer ecommerce-specific questions.
The executive summary should define the business model, customer, product category, sales channels, current traction if any, funding requirement, and economic case.
The company and product section should explain sourcing, differentiation, pricing, intellectual property where relevant, supplier dependencies, and product roadmap.
The market analysis should quantify the target segment and explain why the proposed positioning can win against both direct competitors and substitutes.
The marketing and sales strategy should connect traffic sources, conversion, CAC, retention, and AOV to the revenue forecast.
The operations section should cover suppliers, inventory, fulfillment, returns, customer service, technology, and the operational capacity required at higher order volumes.
The management section should show who owns merchandising, growth, supply chain, finance, technology, and customer experience—and identify important gaps rather than disguising them.
The funding request should connect capital to specific uses such as inventory, customer acquisition, hiring, technology, or working capital.
Finally, the financial plan should reconcile revenue assumptions, gross margin, acquisition spending, operating expenses, inventory purchases, cash flow, and financing.
That is the difference between filling in an ecommerce business plan template and building a plan that can actually be used to allocate capital.
Ecommerce rewards growth only when the economics underneath that growth remain intact. More traffic is not automatically valuable. More orders are not automatically profitable. And higher revenue can create a financing problem when inventory and customer acquisition consume cash faster than the business replenishes it.
That is what an ecommerce Shopify business plan should expose before capital is committed.
Build the model from the order upward: customer acquisition, conversion, AOV, gross margin, fulfillment, returns, repeat purchasing, and inventory. Then test whether the resulting company generates enough contribution and cash to finance the next stage of growth. If it does, the plan has moved beyond a document for investors or lenders. It has become a capital-allocation tool.