Ukraine
 USA
 Austria




A vending machine business is easy to describe and surprisingly easy to model badly.
Buy a machine, secure a location, stock products, collect sales. On paper, the model appears almost frictionless. In practice, profitability is determined by a handful of variables that compound quickly: sales per machine, product cost, location commission, payment fees, service frequency, route density, equipment reliability, and the amount of capital tied up in machines that may or may not perform.
The machine itself is rarely the decisive variable. Location economics are.
A useful vending machine business plan should therefore do more than describe products and target locations. It should establish the economics of one machine, show how those economics change as the route expands, and connect equipment purchases to cash flow and funding requirements.
That distinction matters particularly for entrepreneurs using debt. A route that looks profitable before owner labor, repairs, and debt service can become much less attractive once the complete cost structure is modeled.
Free Vending Machine Business Plan Template + PDF
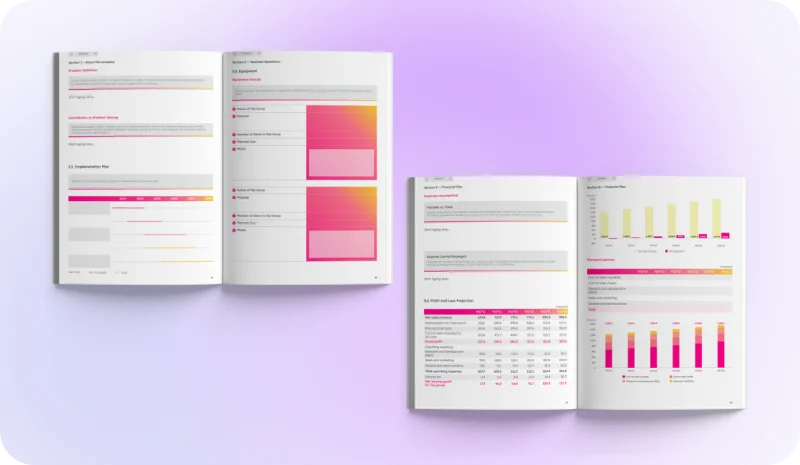
A vending machine business plan template should cover the business model, target locations, equipment strategy, product mix, route operations, marketing and location acquisition, management, funding needs, and financial projections. The financial section should connect machine count and deployment dates to revenue, inventory purchases, commissions, card-processing costs, maintenance, route expenses, and financing.
For founders preparing a vending machine business plan PDF for a bank or other financing discussion, the numbers should be traceable back to operating assumptions rather than presented as stand-alone revenue forecasts. SBA planning guidance similarly recommends supporting a funding request with financial projections and explaining specifically how borrowed funds will be used.
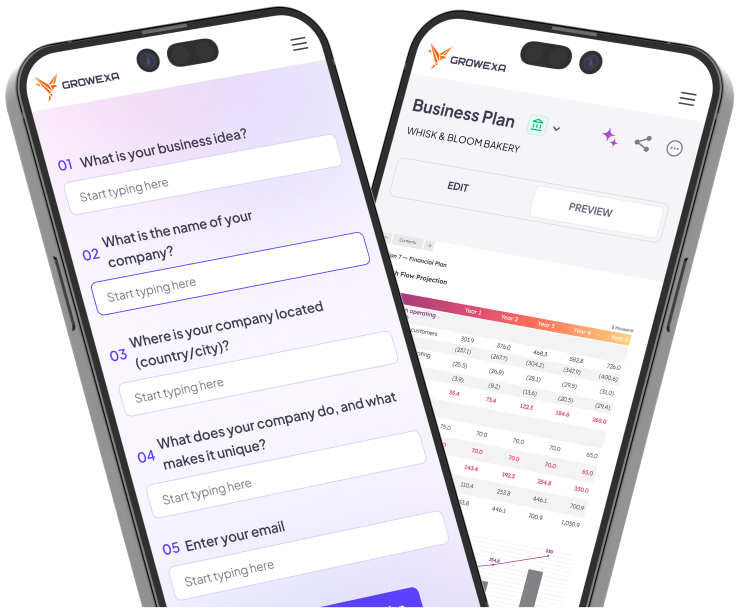
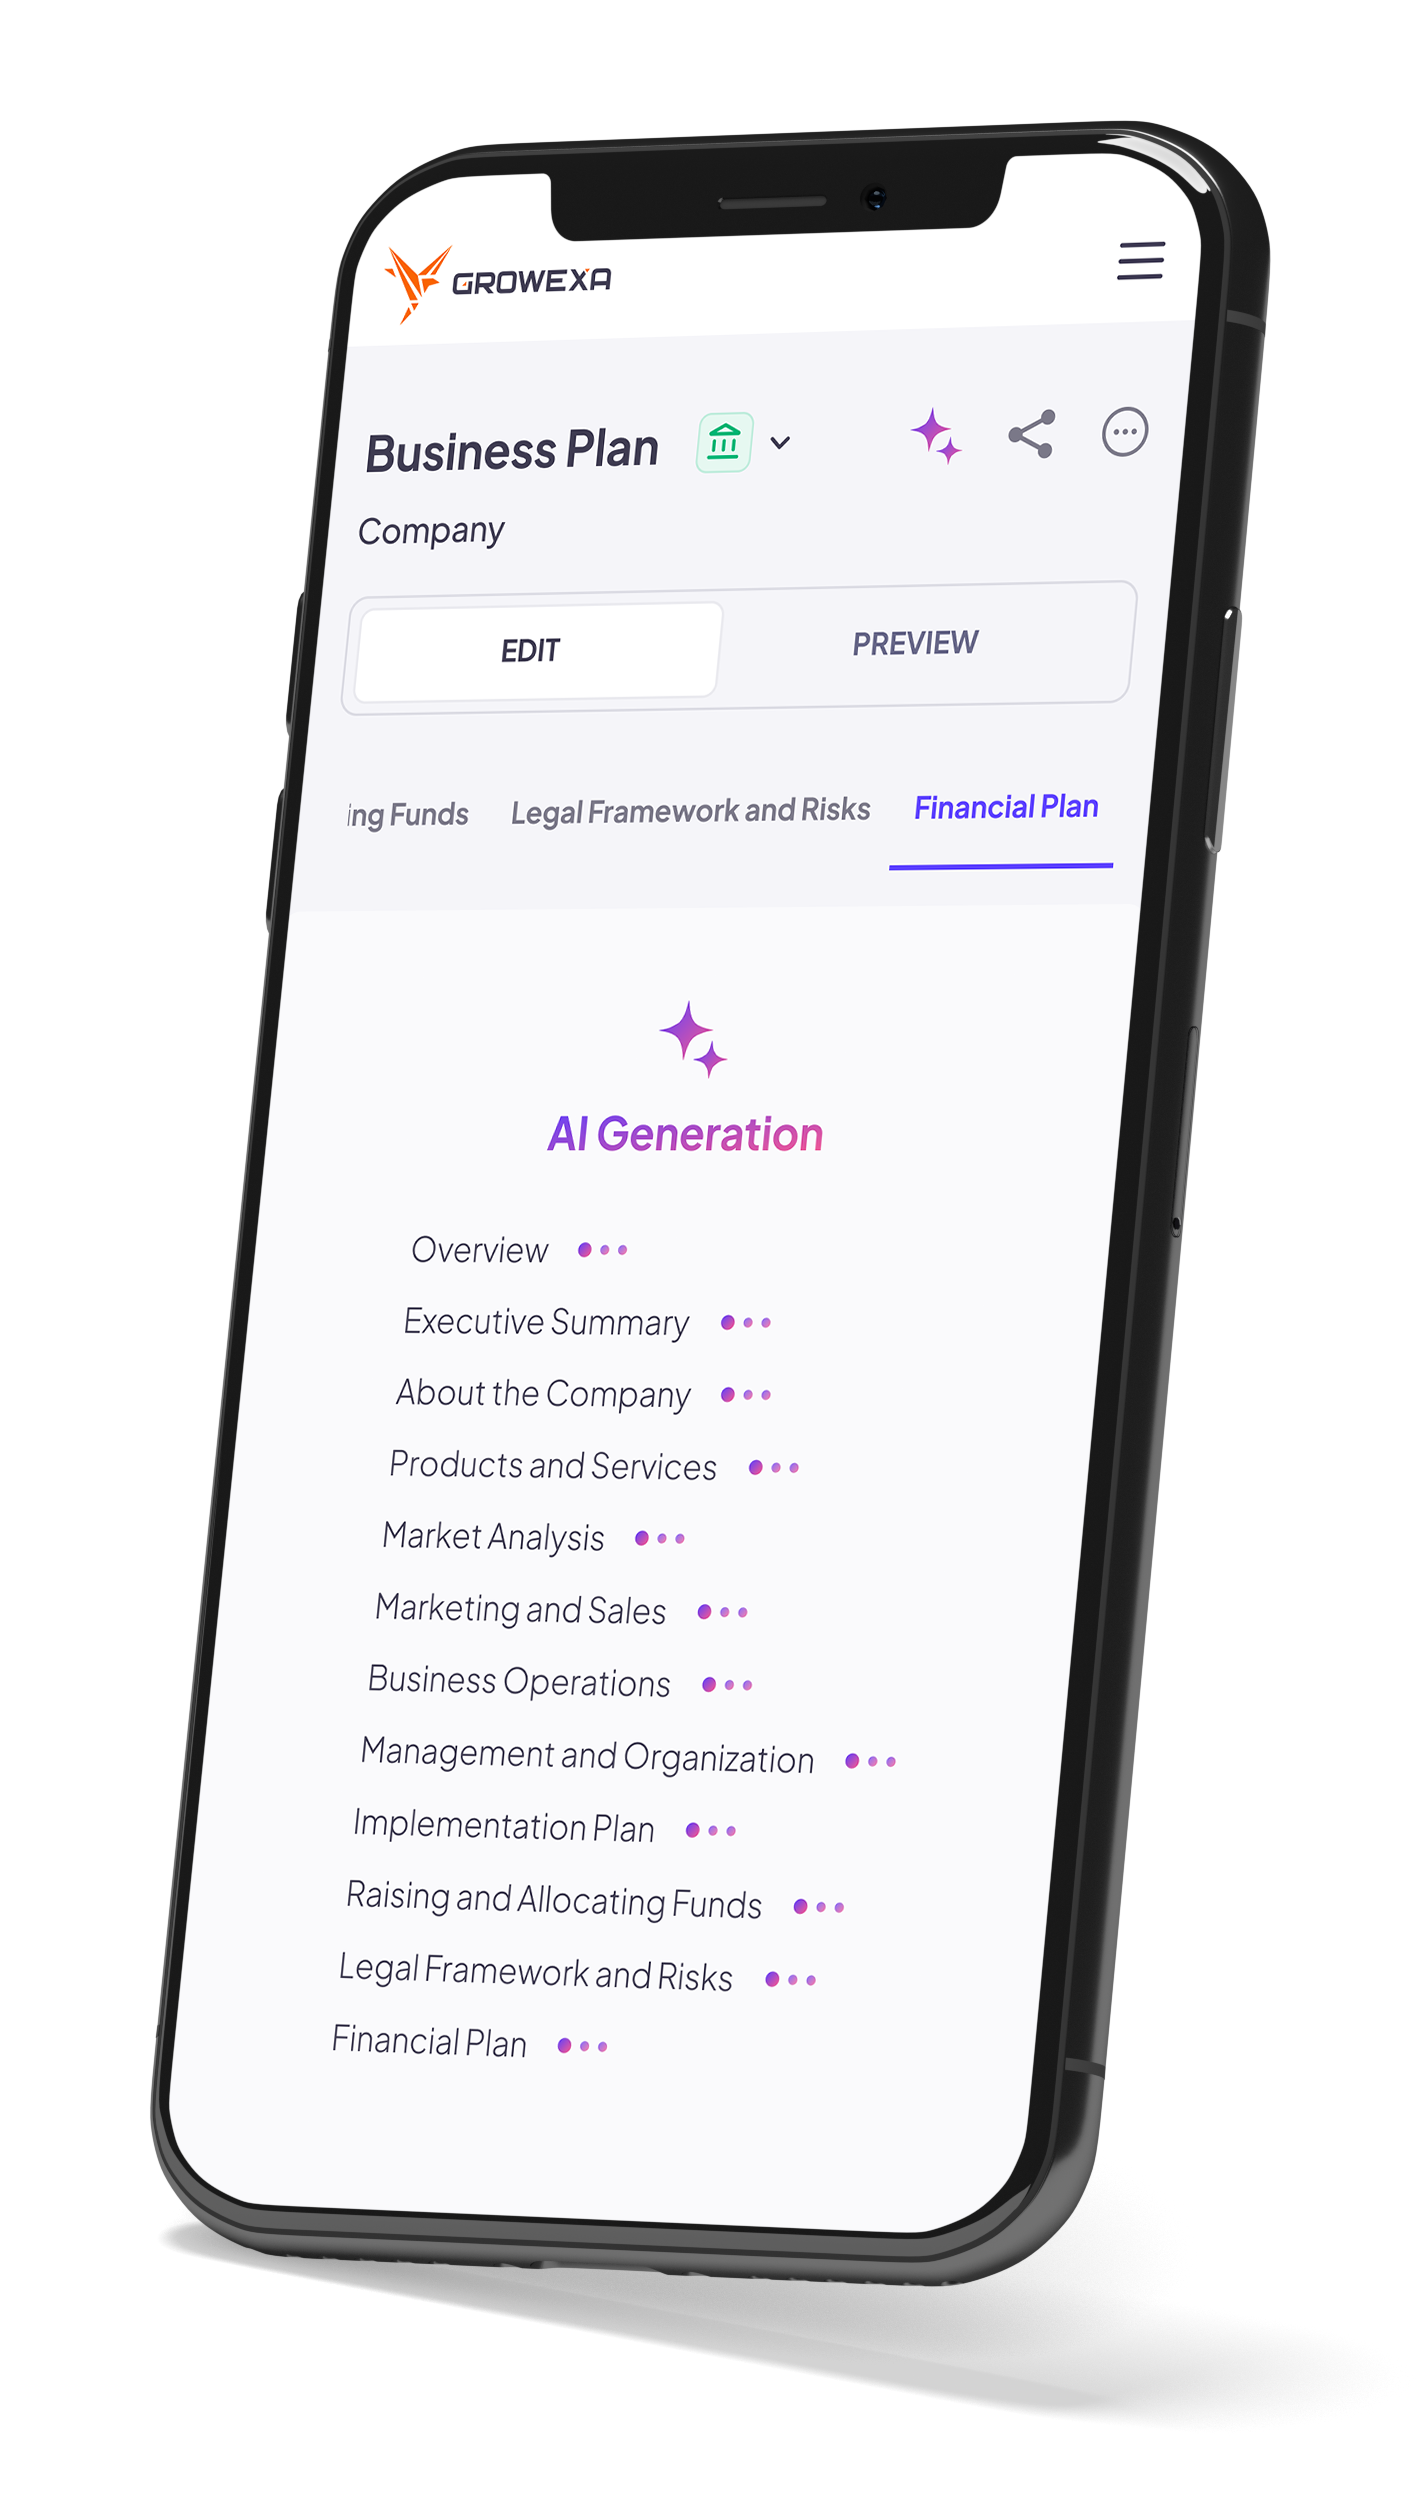
Growexa's AI Business Plan Generator can build the narrative and financial sections together and export the completed plan as a PDF. Its financial model includes projected P&L, cash flow, and balance sheet statements.
The key input, however, remains the operator's own assumptions. Software can structure the model; it cannot turn an untested location into a profitable one.
Vending Machine Business Key Facts
The table below is a planning framework, not a set of industry averages. Equipment costs vary by machine type and condition, while sales and payback can vary dramatically by location.
| Variable | Illustrative Planning Assumption | Why It Matters |
|---|---|---|
| Machine purchase | $2,500–$7,000 | Largest initial asset cost for many traditional setups |
| Delivery and installation | $200–$600 | Raises deployed cost per machine |
| Initial inventory | $300–$700 | Working capital required before first sale |
| Cashless payment hardware | $200–$600 | Important for modern payment acceptance |
| Location commission | 5%–20% of sales | Directly reduces contribution from the location |
| Monthly sales per machine | $1,000–$2,000 example range | Must be estimated for each proposed location |
| Product gross margin | 45%–60% example range | Before commissions and operating expenses |
| Service frequency | 1–4 visits/month | Depends on volume, capacity, and product mix |
| Illustrative payback | 12–30+ months | Highly sensitive to sales and total deployed cost |
One current industry data point illustrates why payment assumptions deserve attention. Cantaloupe reported that 78% of food-and-beverage vending sales in its 2025 data were cashless, while the average cashless ticket was $2.45 versus $1.57 for cash. The overall average vending ticket was $2.01.
Those figures should not be converted into a universal revenue assumption. They do show that a modern vending plan needs to account for cashless payment infrastructure and processing costs rather than treating card acceptance as optional technology.
Choose Your Vending Business Model
The phrase “vending machine business” covers several operating models with different capital requirements and customer behavior. Selecting the format before modeling costs prevents a common mistake: building financial projections for a generic machine that does not resemble the business being launched.
Traditional Snacks and Drinks
Conventional snack and beverage vending remains the simplest model to understand. The operator places machines in workplaces, apartment buildings, hotels, schools where permitted, healthcare facilities, warehouses, and other high-traffic locations.
The advantage is familiar consumer behavior and a broad product supply base. The challenge is differentiation. If the products are widely available elsewhere, convenience and location become central to demand.
A traditional route also creates a straightforward inventory model. Operators can measure sales by SKU, remove slow-moving items, adjust pricing, and increase service frequency as a location matures.
Healthy Vending
A healthy vending machine business plan targets locations where the audience or property manager values a more specific assortment: gyms, healthcare facilities, schools where applicable, premium offices, or wellness-oriented workplaces.
The label “healthy” does not itself improve economics. Some products can have shorter shelf lives, higher acquisition costs, or narrower demand. The plan needs to demonstrate that the target customer values the assortment enough to support the required price and turnover.
A location with strong audience fit can outperform a generic placement. A weak location with premium products is still a weak location.
Smart/Cashless Vending
A cashless vending machine business uses card, contactless, or mobile payment technology and may add telemetry for remote sales and inventory monitoring.
The case for cashless capability has strengthened considerably. Cantaloupe's 2026 report says contactless payments represented 85% of cashless vending sales in 2025, while cashless transactions accounted for 78% of food-and-beverage vending sales in its dataset.
Smart functionality can also improve operations. Remote inventory information can reduce unnecessary service visits, identify stockouts earlier, and give operators better data on product performance. The trade-off is higher equipment or technology cost and ongoing processing or connectivity expenses.
Specialty Vending
Specialty machines can sell electronics, personal-care products, workplace supplies, fresh food, beauty products, pet products, or other merchandise.
These models may support higher transaction values, but they require more precise demand analysis. A snack machine can serve a broad audience. A machine selling a specialized product needs a location where enough customers have the specific purchase need.
That makes specialty vending less about general foot traffic and more about traffic relevance.
Vending Machine Startup Costs
Vending machine startup costs should be calculated in two layers: the capital required to deploy the first machines and the working capital required to operate them until the route becomes self-supporting.
Consider a founder launching five refurbished or mid-range machines:
| Startup Item | Illustrative Cost |
|---|---|
| 5 machines | $20,000 |
| Delivery and installation | $2,000 |
| Initial inventory | $2,500 |
| Cashless hardware/setup | $2,000 |
| Business registration/licenses | $500 |
| Insurance deposit/initial premium | $800 |
| Storage/tools/route equipment | $1,200 |
| Initial location acquisition/marketing | $1,000 |
| Repair reserve | $2,000 |
| Working-capital reserve | $5,000 |
| Total Initial Funding Need | $37,000 |
These figures are illustrative assumptions, not national averages. Actual machine quotes, insurance costs, licensing requirements, inventory costs, and installation expenses should replace them in a real plan.
The $20,000 equipment purchase is only 54% of the modeled funding requirement. That is an important distinction for capital planning. An entrepreneur with $20,000 available cannot necessarily afford $20,000 of machines.
Inventory deserves separate treatment because it is recurring working capital. A route with $2,500 sitting inside machines and storage has converted cash into merchandise that must sell before that capital becomes available again.
Maintenance creates another reserve requirement. A used machine may reduce initial capital expenditure but increase uncertainty around repairs. A new machine may have a higher purchase price but better warranty coverage and lower immediate maintenance exposure. The business plan should model the economics of the equipment actually being purchased rather than assuming that “used” is automatically cheaper.
SBA guidance recommends separating one-time and recurring expenses when estimating startup capital and specifically identifies equipment, inventory, licenses, insurance, marketing, and other operating costs among the categories businesses may need to include.
Before deciding how many machines the available capital can support, run the complete deployment budget through Growexa's startup cost calculator rather than dividing available cash by the advertised machine price.
Choosing Profitable Locations
A vending machine does not have a customer base. A location does.
This is why raw foot traffic is an incomplete metric. A warehouse with 180 employees working long shifts and limited nearby food options can be more valuable than a building with several times the traffic but a convenience store next door.
Evaluate how many people regularly use the site, how long they remain there, operating hours, shift patterns, competing food or retail options, purchasing power, security, machine visibility, and whether the audience fits the proposed products.
Then evaluate the vending machine location agreement.
The agreement may specify commission, electricity, access hours, contract length, exclusivity, termination, servicing responsibilities, and insurance requirements. A 15% commission is neither automatically good nor bad. It has to be evaluated against the sales the location can generate.
Suppose Location A produces $2,000 in monthly sales and charges 15%, or $300. Location B charges no commission but produces $1,200. Assuming similar product economics, avoiding commission does not necessarily make Location B more profitable.
Location selection should therefore be based on contribution after location costs, not simply on commission percentage.
Revenue Calculator
Route Planning and Operations
A profitable machine can become an inefficient route.
Imagine two machines each producing $500 in monthly contribution before route costs. One is five minutes from three other stops. The second requires a 50-mile round trip. Their machine-level financial statements look identical; their operating economics do not.
Vending machine route planning should measure revenue and contribution against the time and distance required to service each location. As machine count increases, route density can become one of the business's most important sources of operating leverage.
Service frequency should also follow sales velocity. Visiting every machine weekly regardless of inventory levels wastes labor and fuel at slower sites. Waiting too long at high-volume sites creates stockouts and lost sales.
Operators should track sales by machine, product velocity, stockouts, spoilage, service time, mileage, repair history, and cash collection where relevant. Cashless and telemetry-enabled machines can make parts of this process easier by providing remote transaction and inventory information.
At scale, the operational question changes from “How many machines do we have?” to “How much contribution does each route hour produce?”
Pricing, Product Mix and Gross Margin
Vending machine profit margin is often misunderstood because product markup, gross margin, and net profit are different numbers.
Suppose a beverage costs $1.00 and sells for $2.50.
The gross profit before other variable expenses is $1.50, producing a 60% product gross margin.
Now assume the location receives 12% of sales, or $0.30, and payment processing and related transaction costs amount to $0.10. The contribution falls to $1.10 before route labor, fuel, maintenance, insurance, spoilage, and company overhead.
The product still has a 60% merchandise gross margin. The business does not have a 60% net margin.
Product mix also matters because margin percentage alone does not determine slot profitability. A product earning $1.50 per sale but selling twice a month may contribute less than a product earning $0.90 and selling 20 times.
The operator should measure contribution dollars per slot over time, not merely percentage markup.
This is where pricing becomes operational. Small increases can materially improve contribution if volume remains stable, while prices that exceed the convenience value of the location can suppress sales. Test pricing by location rather than assuming the entire route needs one price structure.
Revenue per Machine and Scaling the Route
There is no defensible answer to how many vending machines to make a living without first knowing the profit generated by one machine.
Consider three hypothetical locations:
| Location | Monthly Sales | Operating Contribution* |
|---|---|---|
| Strong | $2,200 | $650 |
| Base | $1,500 | $400 |
| Weak | $850 | $120 |
Illustrative contribution after product cost, commission, transaction expenses, servicing allocation, and maintenance reserve; before taxes and debt service.
An operator targeting $6,000 per month in pre-tax business income would theoretically need about 10 strong machines, 15 base-case machines, or 50 weak machines.
That difference is why machine count is a poor growth KPI by itself.
A 20-machine route can be worth less than a 12-machine route if its locations generate lower sales and require more driving. Capital allocation should favor machines with acceptable payback and locations that improve route density.
Expansion should also be staged. Instead of purchasing 20 machines based on one revenue assumption, an operator can deploy five, collect location-level data, refine product and service assumptions, and then decide whether the economics deserve additional capital.
Scale what has been proved—not merely what has been purchased.
Vending Machine Financial Projections
A vending machine business plan financial projections section should be built from machine-level operating assumptions rather than top-down annual revenue growth.
Consider a fictional route starting with five machines and adding five more after the initial locations have been tested.
| Financial Assumption | Year 1 | Year 2 | Year 3 |
|---|---|---|---|
| Average active machines | 5 | 10 | 15 |
| Avg. monthly sales/machine | $1,500 | $1,600 | $1,700 |
| Annual revenue | $90,000 | $192,000 | $306,000 |
| Product cost (45%) | ($40,500) | ($86,400) | ($137,700) |
| Location commissions (12%) | ($10,800) | ($23,040) | ($36,720) |
| Payment fees (4%) | ($3,600) | ($7,680) | ($12,240) |
| Route/maintenance/other operating costs | ($15,000) | ($27,000) | ($40,000) |
| Operating contribution | $20,100 | $47,880 | $79,340 |
These are illustrative figures, not expected industry performance. A real forecast should use the operator's actual product costs, proposed location agreements, payment pricing, service model, equipment financing, and deployment schedule.
The model also needs cash flow.
Buying five additional machines in Year 2 may improve future revenue while reducing cash immediately. Inventory has to be purchased before it is sold. Loan principal affects cash even though it is not treated the same way as an operating expense on the income statement. Equipment purchases affect the balance sheet and cash flow as well as depreciation.
A complete set of financial projections should therefore connect the projected income statement, cash flow statement, and balance sheet rather than treating the P&L as the entire financial model. SBA business-plan guidance similarly recommends forecast income statements, balance sheets, cash flow statements, and capital expenditure budgets.
Break-even should also be explicit. SBA defines break-even as the point where total revenue equals total costs and provides the standard formula of fixed costs divided by contribution per unit. For a multi-product vending route, the practical version is often easier to model using the route's weighted contribution margin.
If monthly fixed route and company costs are $3,000 and the weighted contribution margin after product cost, commissions, and payment fees is 39%, break-even revenue is approximately:
$3,000 ÷ 39% = $7,692 per month
With five machines, that implies roughly $1,538 in average monthly sales per machine before the route covers those modeled fixed costs.
That number is more actionable than a generic statement that vending can be profitable.
Business Plan for a Vending Machine Loan
A vending machine business plan for loan financing should explain exactly what the borrowed capital buys and how those assets generate enough cash to support repayment.
A $50,000 request should not appear as a round number detached from operations. The plan might allocate $30,000 to machines, $5,000 to payment hardware and installation, $5,000 to opening inventory, $3,000 to route equipment and delivery, and $7,000 to working capital. The exact allocation will differ, but every major use should connect to the operating plan.
The revenue forecast should then show when the financed machines are deployed, how sales per machine were estimated, and what happens if new locations ramp more slowly than expected.
This matters because lenders are not evaluating the attractiveness of vending machines in the abstract. They are evaluating whether this particular business can service its obligations.
SBA guidance recommends stating the amount and purpose of requested funding and supporting that request with financial projections; it also notes that businesses seeking loans should prepare a business plan, expense sheet, and financial projections.
A business plan for a bank loan should therefore make the repayment logic visible: machine deployment creates sales, sales create contribution, contribution covers operating expenses, and remaining cash supports debt service.
A lender can challenge the assumptions. It should not have to reconstruct them.
A vending route does not become valuable because it has more machines. It becomes valuable when each additional machine earns an acceptable return without making the route disproportionately harder to operate.
That is the discipline a business plan should impose. Model the deployed cost of each machine, the economics of each location, the density of the route, and the cash required to reach the next stage. Then stress-test the assumptions before committing capital.
The objective is not to produce the most optimistic vending machine business plan example. It is to know which locations deserve machines, which machines deserve additional investment, and whether the route can generate enough cash to finance its own growth.